Topic 5: Air Photo Interpretation
Remote Sensing is considered to be both a science and an 'art' because the image analyst, in the end, has to interpret the information presented. The process of airphoto or image interpretation is one of learning to associate shapes and pattern, and other characteristics, with real features or phenomena on the ground. We are unaccustomed to viewing the ground or the Earth from anything but an oblique perspective, so that vertical images, which lack scale and depth produce what is called Visual Dissonance. With practice and as time goes by, we begin to acquire a better sense of perception.
Object Signature Characteristics
Objects also have visual characteristic which allow us to differentiate them. These characteristics include size, shape, pattern, tone, association, and texture.
TONE refers to the relative brightness or colour of objects in an image. Generally, tone is the fundamental element for distinguishing between different targets or features. Variations in tone also allows the elements of shape, texture, and pattern of objects to be distinguished.
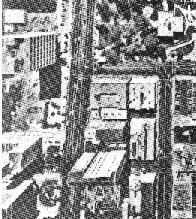
SHAPE refers to the general form, structure, or outline of individual objects. Shape can be a very distinctive clue for interpretation. Straight edge shapes typically represent urban or agricultural (field) targets, while natural features, such as forest edges, are generally more irregular in shape,
SIZE of objects in an image is a function of scale. It is important to assess the size of a target relative to other objects in a scene to aid in the interpretation of that target.
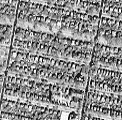
PATTERN refers to the spatial arrangement of visibly discernible objects. Typically an orderly repetition of similar tones and textures will produce a distinctive and ultimately recognizable pattern. Orchards with evenly spaced trees, and urban streets with regularly spaced houses are good examples of pattern.
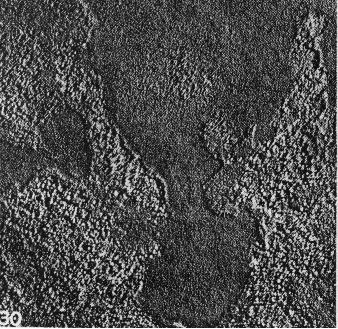
TEXTURE refers to the arrangement and frequency of tonal variation in particular areas of an image. Rough textures would consist of a mottled tone where the grey levels change abruptly in a small area, whereas smooth textures would have very little tonal variation. In the image, black spruce is characterized by a darker smoother tone than the surrounding aspen which is lighter tone and mottled.
SHADOW is also helpful in interpretation as it may provide an idea of the profile and relative height of a target or targets which may make identification easier.
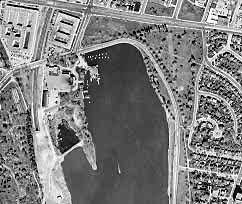
ASSOCIATION takes into account the relationship between other recognizable objects or features in proximity to the target of interest. The identification of features that one would expect to associate with other features may provide information to facilitate identification.
Measuring Areas on Maps and Images
Area sampling with dot grid overlays: This manual technique for determining the area of features on airphotos and maps involves the use of dot grids. A transparent overlay with a grid cell pattern is overlain on the airphoto. By counting the number of cells or dots which occur within a feature it is possible to estimate its area, knowing the area for each dot or cell.
Dot Grid Example: In this example, lets assume that the dot grid overlay fits the 9" x 9" size of an airphoto which has a RF of 1/15840; that is, 1" on the airphoto is equal to 15840" on the ground. This scale can also be restated as 1" = 1320' (or 1/4 mile).
Dot Grid Cell Area Calculation
| If 4 cells on the grid have a length of 1" (1320') then 1 cell has a length of 1/4" (or 330'); the area of a cell then is 330' x 330' = 108900 sq. ft. |
| From conversion tables we know that 1 acre = 43560 sq. ft. |
| The cell area in acres can then be calculated as: 108900 / 43560 = 2.5 acres |
Conversion Tables: There are conversion tables which relate the RF with distance and area measurements, however many times you will be faced with an RF or scale which does not match the list in the conversion table. So the arithmetic method of calculating cell area is required.
Since airphotos are designed to overlap each other along and across flightlines, it is possible to create a mosaic of photos in order to represent the area or sub-area of interest. There are three types of airphoto mosaics: uncontrolled, controlled, and orthophoto mosaics.
Uncontrolled Mosaic: this is the easiest to create, but does not significantly correct for image displacement in the original airphotos. The mosaic is produced by aligning them with images or features on the airphotos. For less image displacement, the centers of the airphotos can be cut out (since they have less displacement) and aligned. Uncontrolled mosaics are commonly used for photo indexing.
Controlled Mosaic: Each airphoto is corrected for aircraft height and tilt variations. The central portion of the airphotos are cut out and aligned with adjacent airphotos in a similar fashion as use for uncontrolled mosaics. Each photo is then further oriented by matching features with survey control points for the area.
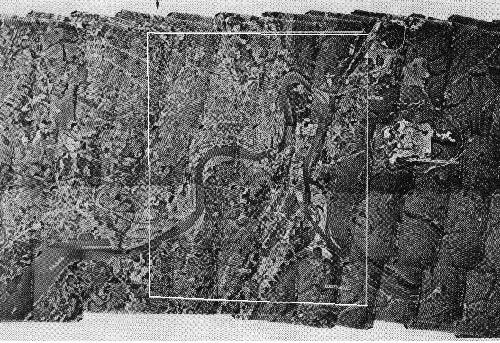
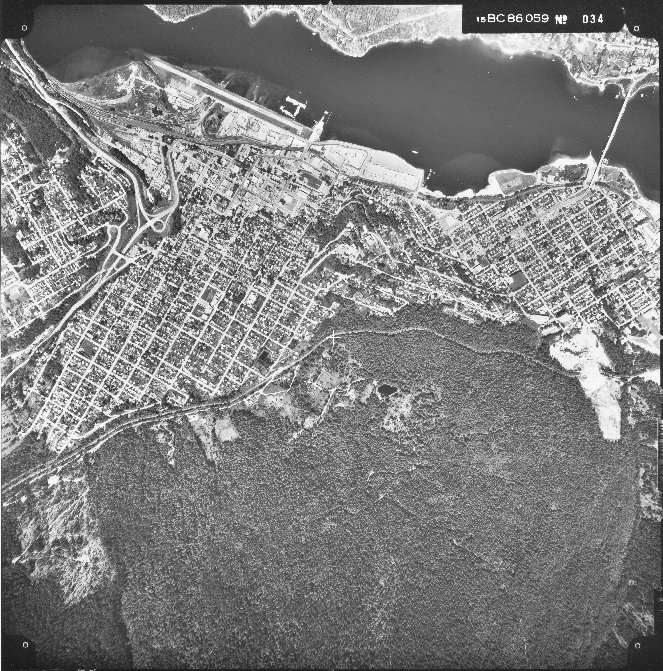
Orthophotos and Orthophoto Mosaics: This process is the most accurate in that it tranforms the airphotos into a larger mosaic that has characteristics of a map (true distance, angles, areas) but can be interpreted like a photograph. The process of conversion is called differential rectification and involves the elimination of photo scale variations and image displacement using an instrument called an orthophotoscope.
Example of an Orthophoto (Nelson, British Columbia)
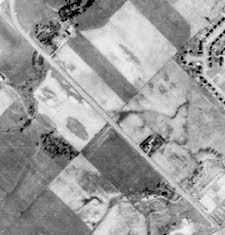
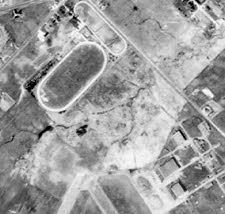
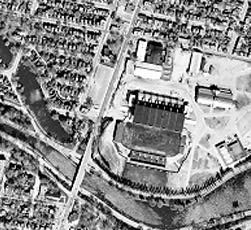
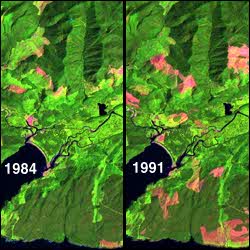
One of the important features of aerial photography and satellite remote sensing is the ability to detect changes on the Earth's surface through time. Airphotos and satellite images taken of the same location separated by several years can provide a way of estimating cultural, physical and environmental changes.
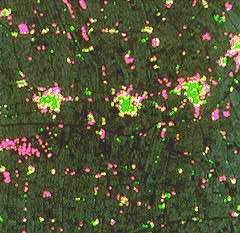
Monitoring Changes in Forest Cover: In the two flase color satellite images taken of the same location, it is possible to estimate the increase in forest clearcutting between 1984 and 1991. Pink areas are cutovers, dark green is forested, light green is replanted or new growth.
Urban Change: By incorporating information from two satellite images designed to classify urban areas, it possible to demonstrate and approximate the increase in urban growth between 1973 and 1985 (selected area of Egypt). The green delineates those areas of urban cover in 1973, and the pink, urban areas for 1985.
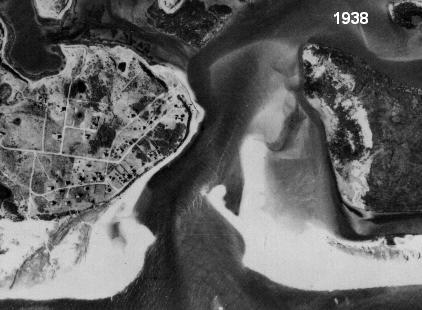
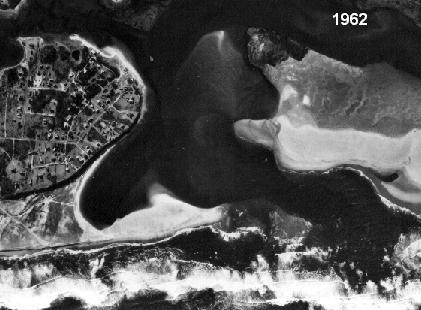
Physical Landscape Change: Landscapes change over time due to the action of wind, rain, water. This is particularly true along coastal areas where rivers carrying sediment enter the ocean, and are affected by wave action and ocean currents. In the following example one airphoto was taken in 1938 and the other in 1962. Note both the cultural and landscape (geomorphological) changes.
 |
 |