TOPIC 14
Environmental Monitoring & Assessment
Remote sensing is an important tool for environmental monitoring and
assessment. Remote sensing can provide a record of change over time and
can record this information for small and large areas ranging from a local to a
global scale.
In addition to remote sensing images from satellites and aircraft,
there are a variety of other sources of information which can be used for environmental
monitoring and assessment these include: topographic maps, digital
terrain maps, land use and land cover maps and
a variety of thematic maps.
Examples of environmental monitoring and assessment
Monitoring
and Assessment of Natural Disasters
Affect of a
hurricane on an area: Landsat Thematic Mapper satellite images taken before
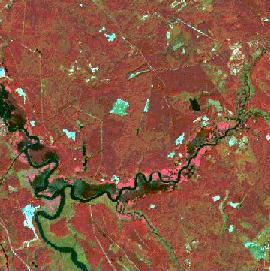
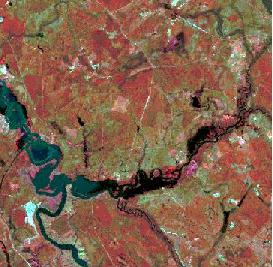
and after the hurricane can be processed in order to assess the damage on forest land.
| Landsat TM prior to Hurricane Hugo 1981 |
Landsat TM after Hurricane Hugo 1983 |
 |
 |
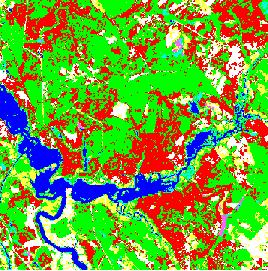 |
Changes in Forest Land After classifying the before
and after Landsat TM images into thematic land cover consisting of Water, Forest, and Bare
Soil, differences between the classified images are calculated to arrive at an assessment
of change.
Red depicts areas that were forested and are bare soil;
Blue depicts water and wetlands; Green
depicts forests not significantly affected by the hurricane. |
Oil Spill
detection and assessment: The areal extent of an oil spill can be tracked
over time and the area impacted can be assessed.
The dark areas off the coast represent the areas where oil is
present and areas of lighter tone directly south are areas where dispersant was
sprayed on the oil to encourage emulsification. Oil, which floats on the
top of water, suppresses the ocean's capillary waves, creating a surface
smoother than the surrounding water. This smoother surface appears dark in the radar
image. As the oil starts to emulsify and clean-up efforts begin to take effect, the
capillary waves are not as effectively damped and the oil appears lighter. Size, location
and dispersal of the oil spill can be determined using this type of imagery.
| Oil Spill Wales coastline, England |
Radarsat Image |
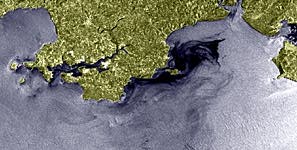 |
A supertanker, the Sea Empress, was grounded near the town of
Milford Haven, Wales on February 15, 1996. After hitting rocks, the outer hull was
breached and approximately 70,000 tonnes of light grade crude oil was dispersed southward
under storm conditions. |
| Oil Spill - Coast of France |
ERS Satellite (Radar) |
 |
Monitored Parameters:
- Spill location
- Size and extent of the spill
- Direction and magnitude of oil movement
- Wind, current and wave information for predicting future oil movement
|
Ocean
Color and Phytoplankton concentration
Ocean color analysis refers to a method of indicating the "health"
of the ocean, by measuring oceanic biological activity by
optical means .
Phytoplankton, are significant building blocks in the world's food
chain and grow with the assistance of sunlight and the pigment chlorophyll.
Chlorophyll, which absorbs red light (resulting in the ocean's blue-green
colour) is considered a good indicator of the health of the ocean and its level of
productivity.
| Phytoplankton Concentration - NASA/NIMBUS CZCS
Satellite |
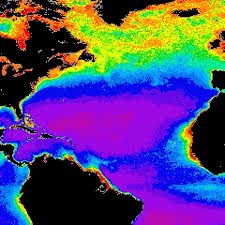 |
Higher phytoplankton concentrations
are displayed in green-yellow-red colors; lower concentrations
in blue-magenta color.
Note major discharge areas in low latitudes such as the Amazon
River, South America have high phytoplankton concentrations along the coast
due to discharges from rivers and nutrient upwelling. |
The ability to map the spatial and temporal patterns of ocean
color over regional and global scales has
provided important insights into the fundamental properties and processes in the marine
biosphere.
| Phytoplankton Concentration - NASA/NIMBUS CZCS
Satellite |
 |
Higher phytoplankton concentrations
are displayed in green-yellow-red colors; lower concentrations
in blue-magenta color. |
Mapping and understanding changes in ocean colour can assist in the management
of fish stocks and other aquatic life, help define harvest quotas,
monitor the water quality and allow for the identification of human
and natural water pollution such as oil or algal blooms, which are dangerous to
fish farms and other shell fish industries.
In general, ocean productivity appears highest in
coastal areas due to their proximity to nutrient upwelling and
circulation conditions that favour nutrient accummulation.
Mapping and
monitoring ozone in the atmosphere
Ozone (O3) is produced in the upper atmosphere through the
interaction of normal oxygen molecules (O2) with incoming
ultraviolet radiation. It has the ability to prevent much of the ultraviolet
radiation from reaching the surface of the earth, thus protecting animal life.
The Ozone concentration of the earth's atmosphere has been mapped by the NOAA/TIROS
and NASA/NIMBUS satellite series since 1979. These studies are
part of NASA's Mission to Planet Earth program which is part of
the larger international Global Change Research Program.
In addition to ozone, the NIMBUS satellite also measured the amount of
nitric acid in the upper atmosphere. These naturally
occurring low levels of nitric acid in the atmosphere (up to12 parts per billion ) are
produced by the interaction of nitrogen and oxygen in the upper
atmosphere. In polar regions, atmospheric nitric acid is more concentrated
reflecting the greater flux of charged particles and ultraviolet
radiation.
| Atmospheric Nitric Acid - NASA/NIMBUS satellite sensor |
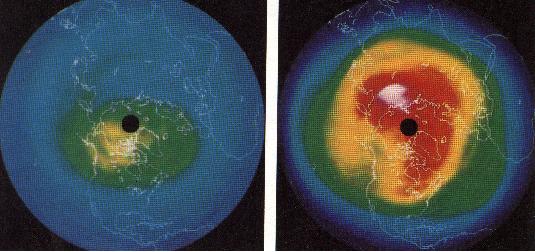 |
Left image is of the upper stratosphere;
Right image is of the lower stratosphere; |
Concentrations of atmospheric nitric acid:
< 4 ppb = blue
4 to 12 ppb = green-yellow-red-white |
Ozone in the atmosphere is destroyed by nitrogen-oxygen
and chlorine-oxygen compounds - such as atmospheric nitric acid,
so one would expect to see some ozone depletion in polar regions where there is an
increase in nitric acid.Other compounds derived from aerosol sprays
produce chlorine-oxygen compounds which also destroy ozone.
Other factors which may influence ozone levels and trace chemical levels in the
atmosphere may be dependent on the changing geomagnetic field and influx of solar
radiation.
| Magnetosphere around the Earth (diagramatic view) |
 |
| Variations in the Earth's Magnetic Intensity |
 |
Blue-Green denotes low magnetic intensity;
Yellow-Red depicts high magnetic intensity. |
Oceanic and Atmospheric
Weather Phenomena
An important weather pattern which has become well known is the El
Nińo phenomenon. The name El Nińo (The Child) refers to the warm ocean
current that appears along the Pacific coast of South America each
year around Christmas. For most of the year the easterly trade
winds push warm equatorial surface waters towards Australia.
This creates a surface divergence along the equator that is filled by cold,
nutrient-rich water moving up from below (upwelling), forming a cold tongue in
the eastern Pacific. This makes Peruvian waters one of the most productive fisheries in
the world.
As the trade winds die seasonally, the bulge of water off eastern
Australia flows back causing the warm water to float over the cold currents off Peru. This
resulting increase in temperature which then temporarily causes the fish to disappear.
The El Nińo weather
phenomenon is when this reversal in surface currents reaches
extreme proportions and causes
a change in traditional rainfall patterns and the release of large amounts of latent heat
into the atmosphere. The subsequent energy propagates within the atmosphere, affecting the
weather in various ways and places and disrupting the normal rhythm of life across the
Pacific Ocean.

Satellite
Remote Sensing of El Nińo phenomenon (1996-97)
Several different remote sensing satellites/sensors have been used to acquire
regional/global information on ocean and weather phenomenon.
1) NOAA/TIROS satellite AVHRR
sensor can measure the sea surface temperature using the thermal infrared
portion of the spectrum. This provides information on the surface water temperature over
the Pacific Ocean over time.
2) TOPEX/Poseidon Satellite/sensor
measures the sea surface elevation which allows tracking of changes in sea level.
3) ADEOS (Advanced Earth
Observing Satellite) with the NASA NSCAT wind sensor, which
measures near surface winds over the ocean (both speed and direction).
4) NASA/NIMBUS satellite with the Coastal
Zone Color Scanner (CZCS) measures the ocean color and the chlorophyll
content (phytoplankton) which is an indication of the nutrient levels and
bilogical health (and productivity) of the ocean.
The following animation is a representation of
the environmental changes affecting the pacific ocean from data acquired by the first
three remote sensing satellite systems: El Nino
Animation
- During 1996, strong winds blowing from east to west pile up water in the western Pacific
- In the west, sea level and sea surface temperatures are
higher than normal.
- In December 1996 and February 1997, two wind bursts blowing from west
to east were observed.
- West winds generate 'Kelvin' waves (represented by sea level rise)
which travels across the Pacific.
- Following the Kelvin waves, warming in the eastern Pacific, and cooling in the west are
observed.
- Climatic effects of warm Pacific waters result in excessive
rains which result in flooding and landslides
in Central America and other anomalous temperature conditions in North
America. Productive fisheries in Peru and western South
American countries are significantly reduced. Normal commercial fish
species replaced by exotic (tropical) fish species off California coast.
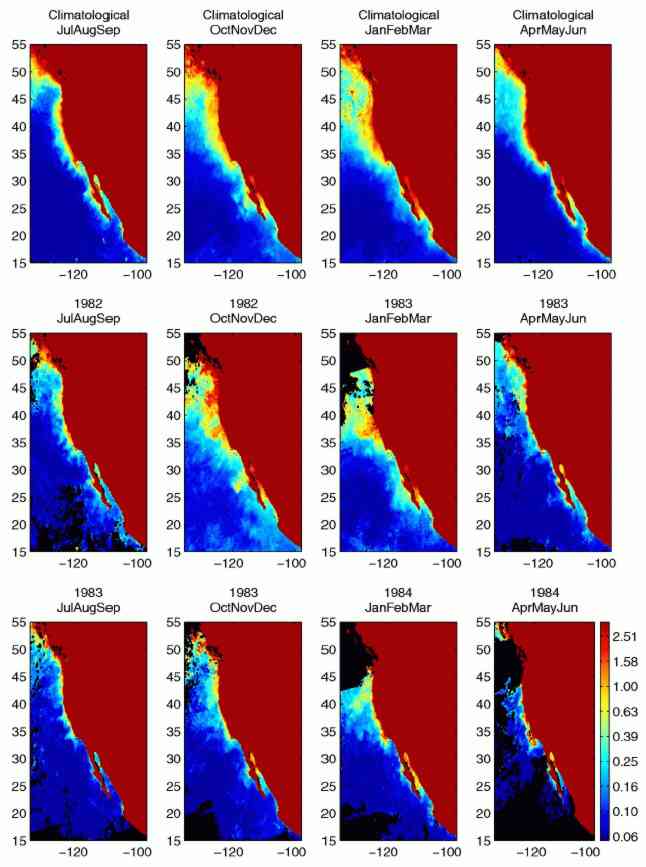
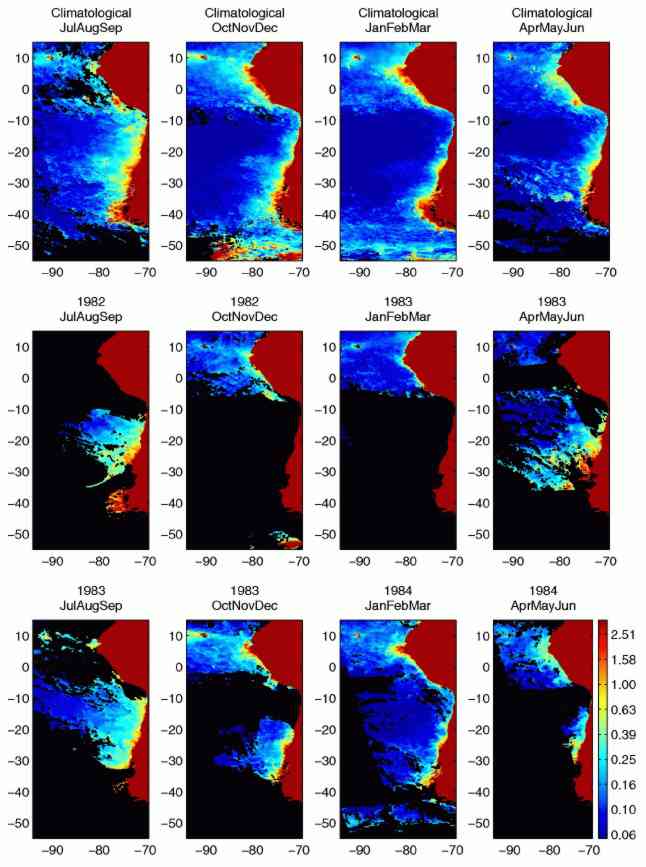
Biological effects of El Nińo using the NIMBUS CZCS Sensor (ocean
color/health/phytoplankton)
Western North America:
first four images are the expected average for each season; 1983 images show the lower
concentration of phytoplankton than average due to El Nińo effect.
Western South America:
first four images are the expected average for each season; In spring and summer 1982-3, pigments are drastically
lower than usual and though they have increased by spring-summer of 1983-4 they are still
reduced and restricted to a narrow region near the coast.
References:
Arnold: p. 204 - 215
also:
Drury, S.A. (1990):A Guide to Remote Sensing, Interpreting Images of the Earth; Oxford
University Press, 199 p.