Satellite Mapping of the Earth's Atmosphere and Water Resources
In addition to remote sensing satellites designed to map land and vegetation, a series of satellites have been launched which are designed to monitor the Earth's atmosphere and hydrosphere. Weather monitoring and forecasting was one of the first civilian applications of satellite remote sensing.
Geostationary Weather Satellites
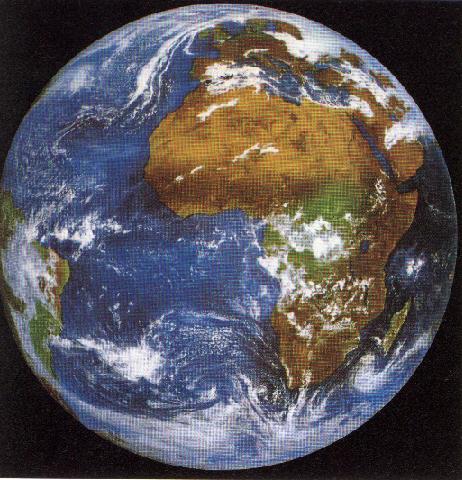
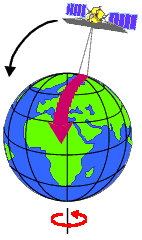
GOES (Geostationary Operational Environmental Satellite): designed by NASA for the National Oceanic and Atmospheric Administration (NOAA) to provide the United States National Weather Service with frequent, small-scale imaging of the Earth’s surface and cloud cover. GOES satellites are placed in geostationary orbits 36000 km above the equator, and view approximately one-third of the Earth.
Geostationary Orbit is where a satellite revolves around the Earth at a speed which matches the Earth's rotation, so as to remain above the same location and appear stationary.

GOES satellites can image the Earth in the visible range (0.55 - 0.70 micrometers) and in the Thermal Infrared range (10.5 - 12.5 micrometers) in addition to several other bands (see table). The satellites provide information on cloud cover every 15 minutes and allow studies on cloud patterns and formation.
| Band | Wavelength Range (mm) | Spatial Resolution | Application |
|---|---|---|---|
| 1 | 0.52 - 0.72 (visible) | 1 km | cloud, pollution, and haze detection; severe storm identification |
| 2 | 3.78 - 4.03 (shortwave IR) | 4 km | identification of fog at night; discriminating water clouds and snow or ice clouds during daytime; detecting fires and volcanoes; night time determination of sea surface temperatures |
| 3 | 6.47 - 7.02 (upper level water vapour) | 4 km | estimating regions of mid-level moisture content and advection; tracking mid-level atmospheric motion |
| 4 | 10.2 - 11.2 (longwave IR) | 4 km | identifying cloud-drift winds, severe storms, and heavy rainfall |
| 5 | 11.5 - 12.5 (IR window sensitive to water vapour) | 4 km | identification of low-level moisture; determination of sea surface temperature; detection of airborne dust and volcanic ash |
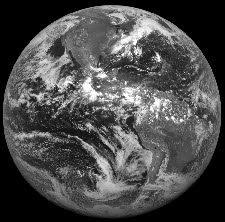
GOES Full Disk Visible Image of North and South America displaying various cloud patterns (mesoscale thunderstorms, "comma-shaped" cyclonic storms).
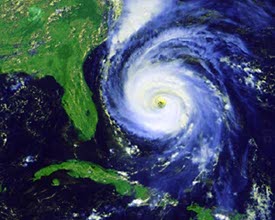
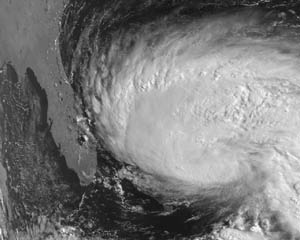
GOES Infrared Image: Hurricane Fran, September 1996 (white is coldest and highest elevation clouds).
Water Vapor Imagery: In addition to the visible and thermal infrared images, it is possible to record energy radiated by water vapor in the 6.7 micrometer range. Images are similar to the thermal infrared but with less well defined boundaries. By monitoring the circulation patterns throughout the day, it is possible to estimate atmospheric wind speeds and directions which allows for the rapid updating of weather maps.
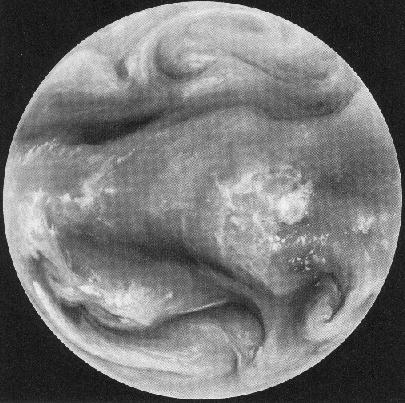
Natural Color Image (same time/location as water vapor image); note that the water vapor image provides a much better representation of the atmospheric circulation patterns.
These meterological satellites complement the GOES satellites, but are in a sun-synchronous, polar orbit (similar to Landsat). The satellites employ a number of sensors, the most important of which is the Advanced Very High Resolution Radiometer (AVHRR). The AVHRR sensor detects radiation in the visible, near and mid infrared, and thermal infrared portions of the electromagnetic spectrum, over a swath width of 3000 km.
Sun-Synchronous, Polar Orbits
NOAA/TIROS AVHRR Spectral Bands
| Band | Wavelength Range (mm) | Spatial Resolution | Application |
|---|---|---|---|
| 1 | 0.58 - 0.68 (red) | 1.1 km | cloud, snow, and ice monitoring |
| 2 | 0.725 - 1.1 (near IR) | 1.1 km | water, vegetation, and agriculture surveys |
| 3 | 3.55 -3.93 (mid IR) | 1.1 km | sea surface temperature, volcanoes, and forest fire activity |
| 4 | 10.3 - 11.3 (thermal IR) | 1.1 km | sea surface temperature, soil moisture |
| 5 | 11.5 - 12.5 (thermal IR) | 1.1 km | sea surface temperature, soil moisture |
NOAA/TIROS Weather System Forecasting
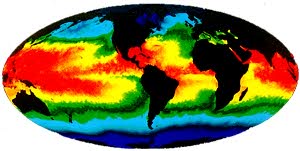
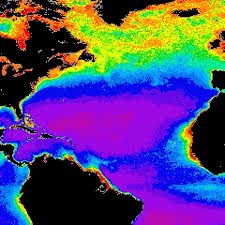
NOAA/TIROS Sea Surface Temperature: red represent higher sea surface temperature, blue lower sea surface temperature.
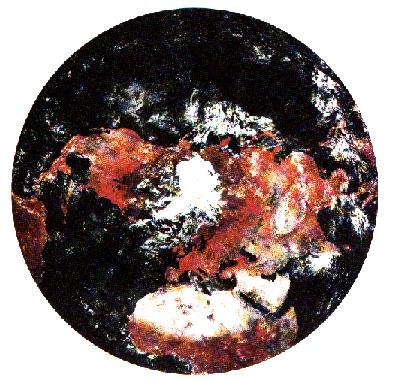
NOAA/TIROS Vegetation Cover: mosaic of false-color images for the northern hemisphere showing summer vegetation.
NIMBUS satellites are designed primarily for research applications. NIMBUS-7 launched in 1978 has 8 meterological sensors and an ocean sensor called the Coastal Zone Color Scanner (CZCS). Oceans play an important role in global climate and contain an abundance of living organisms and natural resources which are susceptible to pollution.
Coastal Zone Color Scanner (CZCS): consisted of 6 spectral bands, the first 4 bands were optimized to allow detailed discrimination of differences in water reflectance due to phytoplankton concentrations and other suspended particulates in the water.
CZCS Spectral Bands
| Channel | Wavelength Range (mm) | Primary Measured Parameter |
|---|---|---|
| 1 | 0.43 - 0.45 | Chlorophyll absorption |
| 2 | 0.51 - 0.53 | Chlorophyll absorption |
| 3 | 0.54 - 0.56 | Gelbstoffe (yellow substance) |
| 4 | 0.66 - 0.68 | Chlorophyll concentration |
| 5 | 0.70 - 0.80 | Surface vegetation |
| 6 | 10.5 - 12.50 | Surface temperature |
Phytoplankton Concentration derived from the NIMBUS CZCS sensor: Higher phytoplankton concentrations are displayed in green-yellow-red colors; lower concentrations in blue-magenta color. Note major discharge areas in low latitudes such as the Amazon River, South America have high phytoplankton concentrations along the coast.
Total Ozone Mapping Spectrometer (NIMBUS-7 TOMS):
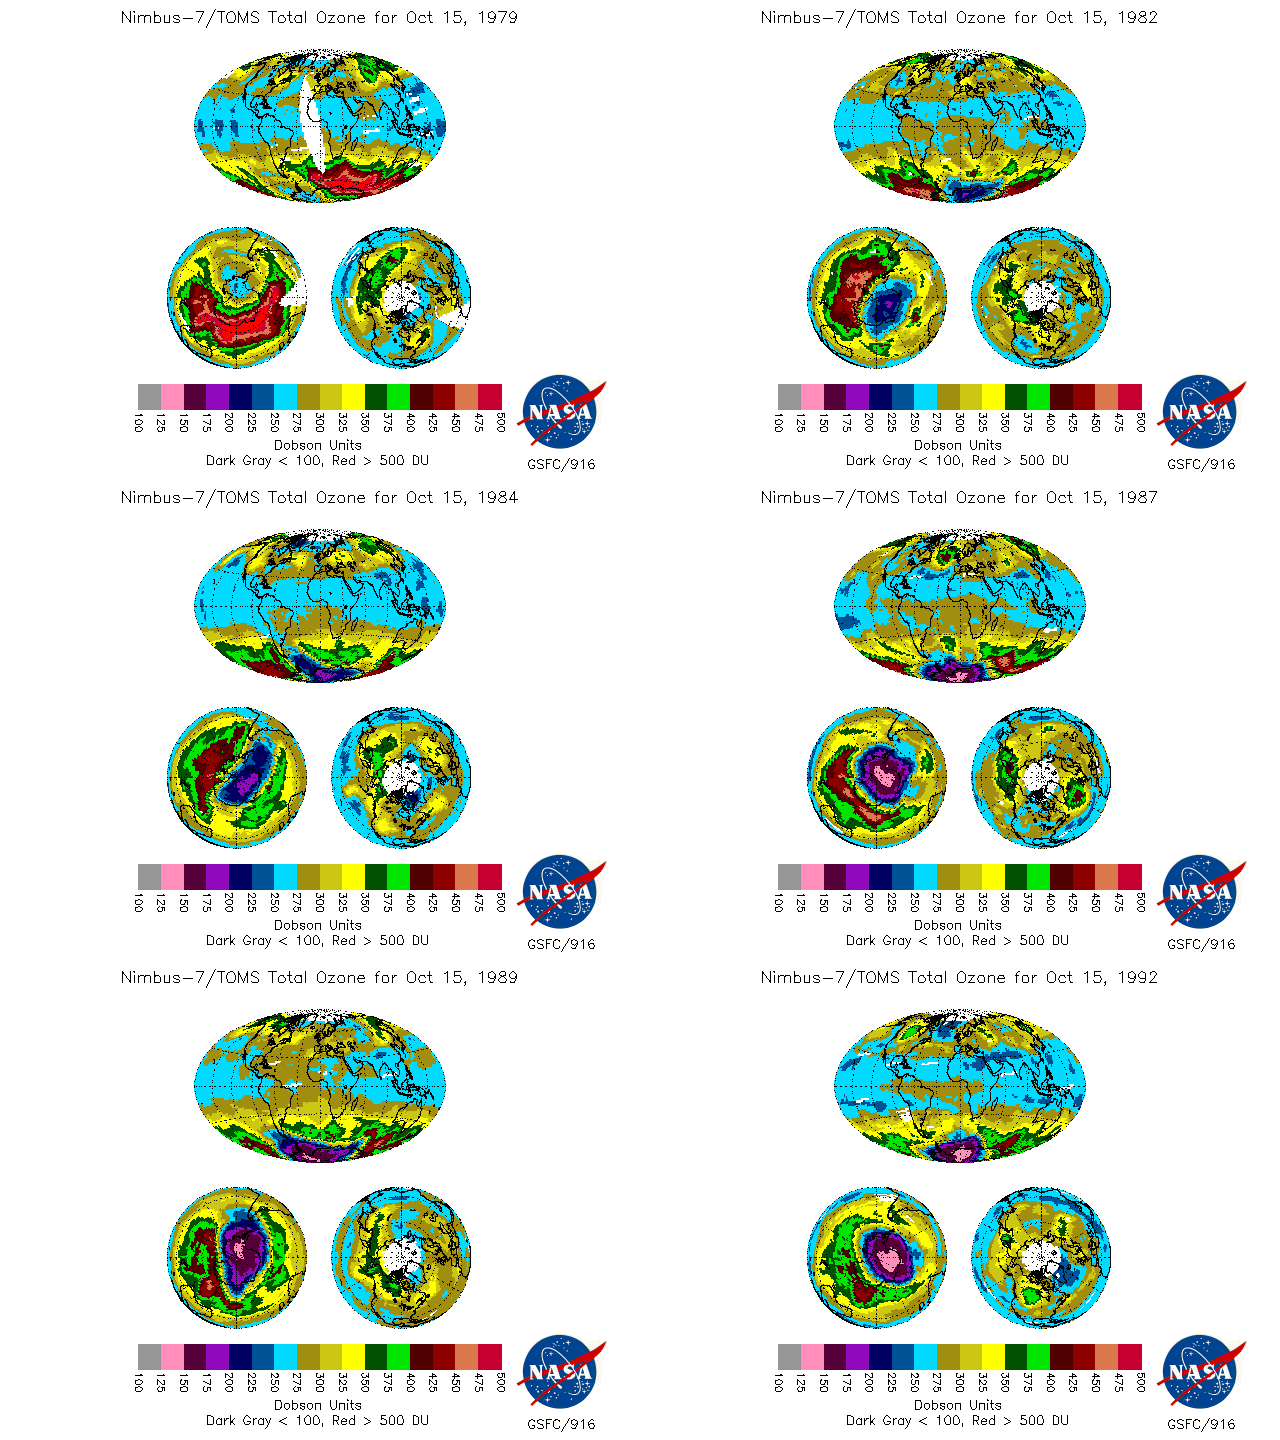
The Ozone concentration of the earth's atmosphere has been mapped by the NOAA/TIROS and NASA/NIMBUS satellite series since 1979. These studies are part of NASA's Mission to Planet Earth program which is part of the larger international Global Change Research Program.
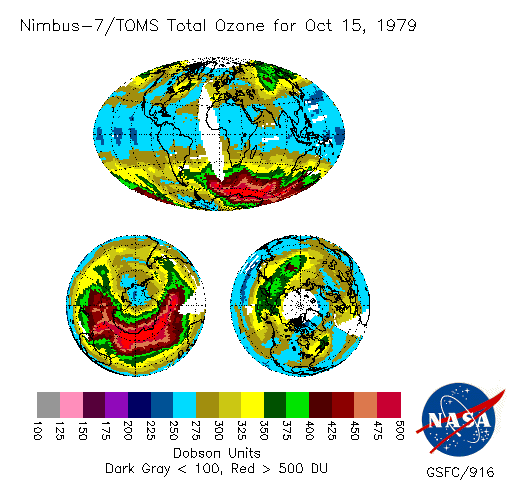
Total Ozone concentration over time 1979-1992
