TOPIC 11
Satellite Mapping of Earth Resources
Modern spectral remote sensing of the earth's surface began in 1972 with the launch of Landsat 1 (also refered to as Earth Resources Technology Satellite: ERTS 1). This was followed by additional satellites up to the most recent Landsat 7. Other countries have launched similar remote sensing satellites such as SPOT (France, Belgium, Sweden), IRS (India), JERS (Japan). The satellite orbits and sensor characteristics have broad similarities.
Satellite Orbits: Landsat satellites have near polar orbits which are sun-synchronous. That is, they have near circular orbits which are nearly north-south in their heading. They are sun-synchronous because they pass over the same latitude at the same local time every day. This ensures consistent illumination conditions when acquiring images in a specific season over successive years, or over a particular area over a series of days.
Satellite Swath: The area of the earth which is imaged during a satellite orbit is referred to as the satellite swath and can range in width from ten to hundreds of kilometers. As the satellite orbits the earth a different area is covered due to the earth's rotation. The elevation of the satellite orbit is designed so that the same location will be retraced (imaged) in a period of several weeks.
Electronic remote sensors (as opposed to photographic) acquire data using scanning systems, which employ a sensor that sweeps over the terrain to build up and produce a two-dimensional image of the surface. These sensors are referred to as multispectral scanning systems (MSS) because they collect data over a variety of wavelength ranges. There are two main methods employed to collect multispectral data: Across Track Scanners and Along Track Scanners.
Across Track Scanners: These scanners scan the earth as a series of lines perpendicular to the direction of movement of the satellite (across the swath). Each line is scanned using a rotating mirror. The incoming radiation is then separated into spectral components (bands) and the energy is measured by a series of detectors which convert it to a digital value.
 |
A: Rotating Mirror B: Detectors C: Instantaneous Field of View D: Ground Resolution Cell E: Angular Field of View F: Swath |
Along Track Scanners: These scanners are also called 'pushbroom' scanners and create an image by sampling perpendicular to the direction of motion, but do not use a rotating mirror. Instead they use a linear array of detectors located at the focal plane of the image, which are "pushed" along in the flight track direction (i.e. along track). They are analogous to common desktop scanners, but use a lense to focus the image onto the detectors.
 |
A: Linear Array of Detectors B: Focal Plane of Image C: Lense D: Ground Resolution Cell Advantages over across track |
Ground Resolution: The resolution of objects on the ground is dependent on the elevation of the satellite, the instantaneous field of view (IFOV), and the time the detector 'sees' the ground cell (dwell time). Depending on the remote sensing satellite, the ground resolution cell may range from 10 to 80 meters and the ground area per scene may range from 40 to 300 kilometers. The following example is from the Landsat MSS.
Program was designed as an experiment to test the feasibility of collecting multi-spectral Earth observation data from an unmanned satellite platform. The success of the program has been due to several factors:
Landsat 2 |
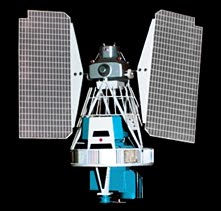 |
Landsat Multispectral Scanning System (MSS): Landsat MSS collects reflected and/or radiated energy from the Earth in four bands or channels of the electromagnetic spectrum. An image is created from the information acquired in each band which provides the interpeter with a greater likelihood of identification.
| Channel (Band) | Channel (Band) | Wavelength Range (mm) | ||
|---|---|---|---|---|
| Landsat 1,2,3 | Resolution | Landsat 4,5 | Resolution | |
| MSS 4 | 79 m | MSS 1 | 82 m | 0.5 - 0.6 (green) |
| MSS 5 | 79 m | MSS 2 | 82 m | 0.6 - 0.7 (red) |
| MSS 6 | 79 m | MSS 3 | 82 m | 0.7 - 0.8 (near infrared) |
| MSS 7 | 79 m | MSS 4 | 82 m | 0.8 - 1.1 (near infrared) |
Return Beam Vidicon (RBV): This sensor is similar to a video camera and was used on Landsat 1,2,3. The RBV provided a higher resolution (30 meter) panchromatic (single band) image which hade the advantage of higher ground resolution than the MSS. With the advent of the 30 meter TM 7 band images, the RBV system was not used after Landsat 3.
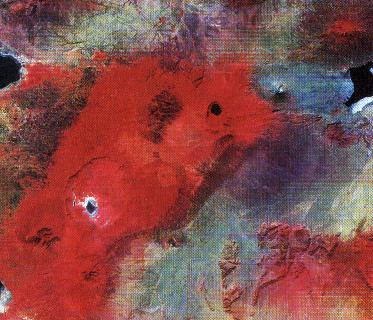
Standard RGB Array: Landsat MSS bands 4, 5, and 7 are the equivalent energy levels used for Color Infrared photographs. By combining these three bands to produce a False Color Composite, it is possible to duplicate CIR photography. The intensities for each MSS band are represented as: MSS band 4 = Blue, MSS band 5 = Green, MSS band 7 = Red
Rift Valley of Kenya and Tanzania - dry season |
 |
Landsat Thematic Mapper (TM): Landsat TM remote sensing started with Landsat 4. The collection of MSS data ceased in 1992 and was replaced by the TM sensor which has a number of improvements over MSS such as:
| Channel | Wavelength Range (mm) | Resolution | Spectrum |
|---|---|---|---|
| TM 1 | 0.45 - 0.52 | 30 m | Blue |
| TM 2 | 0.52 - 0.60 | 30 m | Green |
| TM 3 | 0.63 - 0.69 | 30 m | Red |
| TM 4 | 0.76 - 0.90 | 30 m | Near IR |
| TM 5 | 1.55 - 1.75 | 30 m | Short Wave IR |
| TM 6 | 10.4 - 12.5 | 120 m | Thermal IR |
| TM 7 | 2.08 - 2.35 | 30 m | Mid IR |
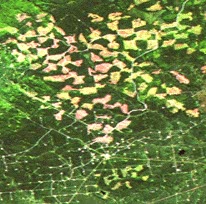
Landsat TM Image: In northern Alberta, Canada, the high spatial and spectral resolution of Landsat TM makes it possible to clearly delineate harvested areas (clearcuts) in a conifer forest.
| Channel | Spectrum | Application |
|---|---|---|
| TM 1 | Blue | cultural/urban feature identification; soil/vegetation discrimination; bathymetry/coastal mapping; |
| TM 2 | Green | cultural/urban feature identification; green vegetation mapping (measures reflectance peak); |
| TM 3 | Red | cultural/urban feature identification; vegetated vs. non-vegetated and plant species discrimination (plant chlorophyll absorption); |
| TM 4 | Near IR | identification of plant/vegetation types, health, and biomass content; water body delineation; soil moisture |
| TM 5 | Short Wave IR | sensitive to moisture in soil and vegetation; discriminating snow and cloud-covered areas |
| TM 6 | Thermal IR | vegetation stress and soil moisture discrimination related to thermal radiation; thermal mapping (urban, water) |
| TM 7 | Mid IR | discrimination of mineral and rock types; sensitive to vegetation moisture content |
The SPOT (Systčme Pour l’Observation de la Terre) program is similar to the Landsat program and was launched in 1986 by CNES (Centre National d’Études Spatiales) of France, with support from Sweden and Belgium. Satellites are in sun-synchronous, near-polar orbits at altitudes around 830 km above the Earth, which results in orbit repetition every 26 days. SPOT satellites were the first to use 'pushbroom' along track sensor technology.
SPOT Imaging System: There are two imaging systems onboard the SPOT satellites: a panchromatic and a multispectral system; the panchromatic consists of a high resolution (10 meter), single channel, and the multispectral is a coarse resolution, three channel.
| Mode/Band | Wavelength Range (mm) | Resolution | Swath |
|---|---|---|---|
| Panchromatic | |||
| Band 1 | 0.51 - 0.73 (blue-green-red) | 10 m | 60 Km |
| Multispectral | |||
| Band 1 | 0.50 - 0.59 (green) | 20 m | 60 Km |
| Band 2 | 0.61 - 0.68 (red) | 20 m | 60 Km |
| Band 3 | 0.79 - 0.89 (near infrared) | 20 m | 60 Km |
Stereoscopic Imaging: SPOT has the ability to view the earth on either side of the satellite’s vertical track (nadir). The ability to point the sensors up to 27° from nadir, allows SPOT to view within a 950 km swath and to revisit any location several times per week.It also provides the capability of acquiring imagery for stereoscopic coverage.
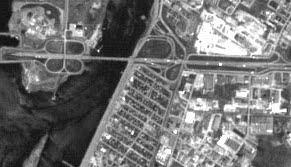
SPOT Image Example: SPOT panchromatic images can provide a significant amount of detail due to the 10 meter resolution. The multispectral images can also be sharpened by combining the three band 20 meter images with the 10 meter panchromatic. The stereoscopic imaging allows for the derivation of topographic information (Digital Elevation Models - DEMs) from the satellite data.
Space Shuttle Photography (STS Photography)
Large Format Camera: This is a camera carried on-board the Space Shuttle which is capable of wide-angle, high resolution, stereo photography. An example of the photography is on the front cover of the reference book by Arnold, of the Cape Code, MA area.
Shuttle hand-held Photography: Throughout NASA's Manned Space Program photographs have been taken of the earth by astronauts using hand-held cameras. An archive of this photography is available through the EROS Data Center (EDC) and other NASA organizations. Most of the photography is vertical to low oblique and portrays meteorological phenomena, hydrologic features, geomorphic landforms, and patterns of human habitation.
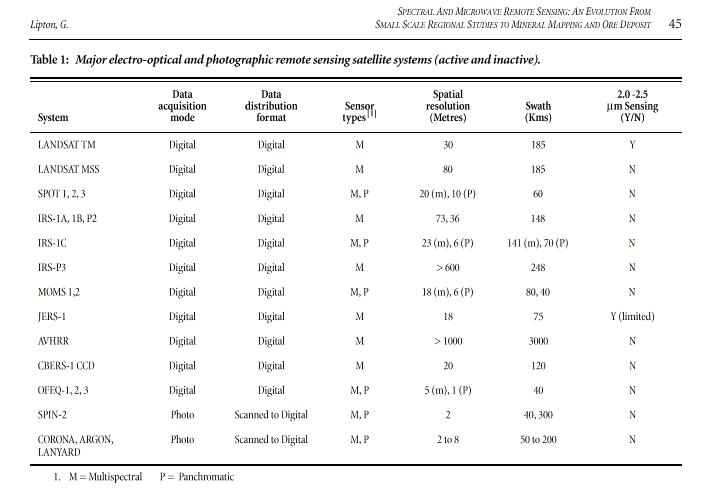
There is an increasing number of satellite imaging systems in addition to the Landsat and SPOT Programs. These remote sensing satellites have generally similar capabilities as those described for Landsat and SPOT, but are operated by other nations or corporations.
Government Operated Imaging Satellite Systems: A short summary is given in the next figure, they include the IRS Program (Indian Remote Sensing satellite) and JERS (Japan Earth Resource Satellite).
Arnold: p.78 -132