Topic 1: Introduction to Remote Sensing
Remote – away from or at a distance
Sensing – detecting a property or characteristic
Definitions:
| "The examination, measurement, and analysis of an object without being in contact with it." |
| "The science and art of obtaining information about an object, area, or phenomenon through the analysis of data acquired by a device not in contact with the object, area, or phenomenon in question" |
| "Remote sensing is the science (and to some extent, art) of acquiring information about the Earth's surface without actually being in contact with it. This is done by sensing and recording reflected or emitted energy and processing, analyzing, and applying that information". |
Sight is the most important of the five senses and the most important remote sensing ‘instrument’ that we use.
The lens and cornea focus an image on a curved photosensitive surface called the retina, coated with about 130 million individual detectors. The detectors are subdivided into rods and cones. Rods are sensitive to brightness whereas cones are sensitive to color.
Other instruments such as aerial photography and satellite imaging are to assist us in perceiving what is beyond the physical or practical limits of human perception.
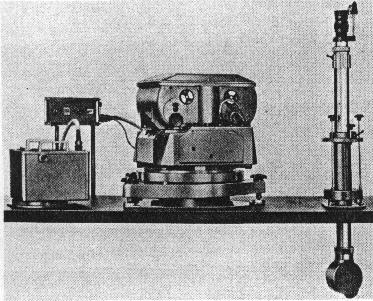
Aerial Camera
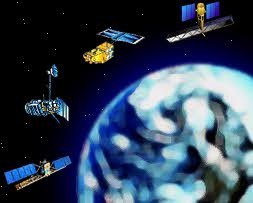
Remote Sensing Satellites i.e. Landsat, Radarsat, SPOT, GOES
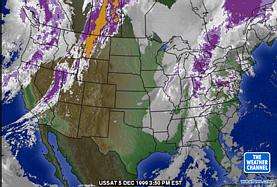
Weather: It is possible now to get immediate information on climate and weather conditions from remote sensing satellites. Images over time allow us to predict weather behavior.
Weather pattern over central North America from the NOAA GOES Satellite.
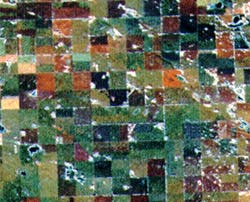
Agriculture: Crop mapping and yield prediction; crop damage due to storm, drought or disease and insect outbreaks.
SAR/optical integration for crop mapping.
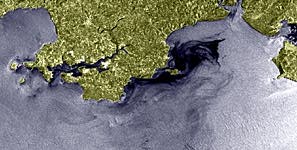
Environmental Impacts: Remote Sensing to determine oil spill size, location, direction and magnitude of movement.
Coastal oil spill, Wales, England
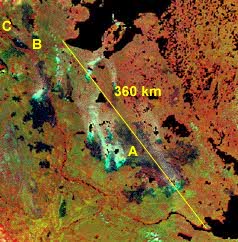
Forestry Inventory: Remote Sensing used for forest inventory, mapping cut-overs, forest fire mapping, species identification.
Burned and burning forest near Norman Wells, NWT , Canada
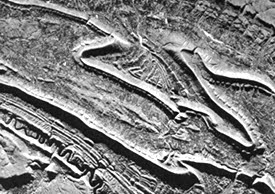
Geological Mapping: Mapping faults, folds, lineaments and rock types.
Syncline/Anticline structures in the Applachians of Pennsylvania.
Active and Passive Remote Sensing systems
Active: where the object is illuminated by radiation produced by the sensors, such as radar or microwaves.
Passive: The sensor records energy that is reflected or emitted from the source, such as light from the sun. This is also the most common type of system.
During this course we will be working with maps, vertical aerial photos and satellite images.
During the first half of this course we will be working with vertical aerial photography in conjunction with and as a map. In the recent past it is through the use of remote sensing and aerial photography that a variety of maps have been developed to represent features on the ground.
A vertical aerial photograph is an approximation of a map. Photography involves a Perspective
View that distorts the image, whereas a map is an Orthographic (or
Planimetric) View that does not impose this distortion.
Perspective View: An airphoto is
a perspective view with the projection lines converging through the camera's lense.
Features are displaced radially outwards from their planimetric positions.
Orthographic or Planimetric View: Perpendicular projection of all positions to a horizontal plane. Planimetric distance A' - B' underestimates the terrain distance and straight-line distance from A to B.
Maps have three main attributes: Scale, Projection and Symbolization
Map Scales: Maps commonly are smaller than the reality they represent. Map scales tell us what the relationship is between a features representation on a map and its size in the real world.
Scale Representation: There are three ways to represent map scales;
![]()
Small Scale – more area covered, zoomed-out, state versus city
Large Scale – more detail, zoomed-in, city versus state
Small Scale: i.e. approximately 1 : 5,000,000
Large Scale: i.e. approximately 1 : 500,000
Gersmehl: p. 1-41
Arnold: p. 1-6
Monmonier: p. 1-24; p.163-173; p. 187-189