Topic 9: Geographic Information Systems
Geographic Information Systems (GIS) are a technological development that combines the world of database management with digital maps and graphics. Many of the concepts covered in the previous lectures, are incorporated into GIS which allows us to automate manual procedures and provides a rapid method of map analysis and interpretation.
Definition: A Geographic Information System can be defined as:
| "A system of computer hardware, software and procedures designed to support the capture, management, analysis, modeling and display of geographically referenced data for decision making. It is a way in which to begin to represent and model the real world." |
General Definition: a geographic information system is any manual or computer-based set of procedures used to store, manipulate, and analyse geographically referenced data.
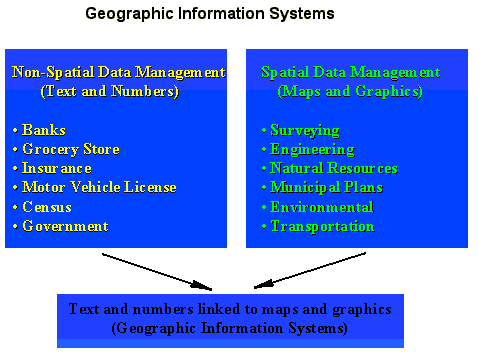
General Background: In basic terms, GIS adds the geographic or spatial component to numerical and textual data.

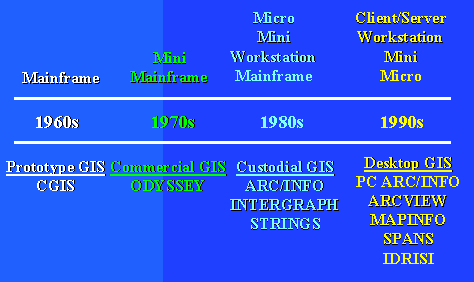
Historical Perspective: The use of computerized GIS has been around since the 1960's, but required specialists and expensive mainframe computers to be able to run the system. With the advent of the PC, powerful CPU's, and inexpensive memory, GIS is now available to anyone at relatively low cost.
There are two methods (or data models) used to structure Geographic Information Systems: the Raster Data Model and the Vector Data Model. The raster model is most effective for modelling and is commonly used with image processing; the vector model is more widely used, provides higher accuracy and better cartographic capabilities. GIS software now combines both these methods, including image processing capabilities (i.e. ArcView (vector GIS), ArcView Spatial Analyst (raster GIS), ArcView Image Analyst (image analysis)
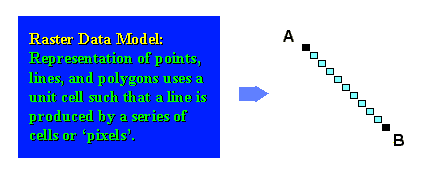
Raster Data Model: In raster-based GIS the spatial data such as line, points and areas are represented using cells or 'pixels'.
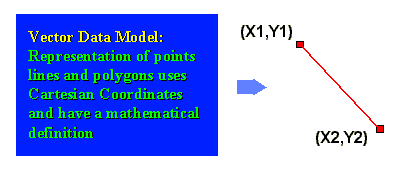
Vector Data Model: In a vector-based GIS the spatial data such as points, lines, and areas have a mathematical definition (i.e. Cartesian Coordinates).
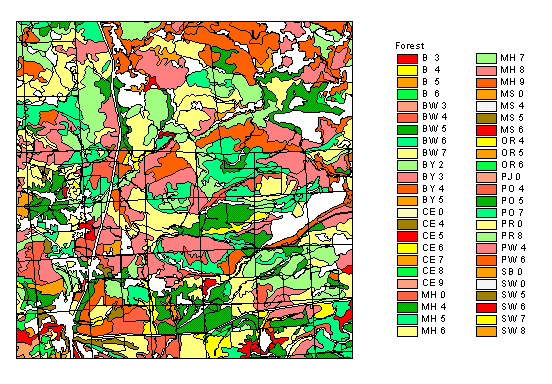
Vector GIS Example: The spatial or geographic components in a GIS are defined by points, lines and areas (polygons). In this example, each area (color) represents a forest stand type; each spatial entity is linked to a database of information which contains the various characteristics of the forest stand (i.e. stand type, stocking, age, etc.). The database is commonly referred to as an 'attribute table' since it contains the attributes or characteristics of the forest stand.
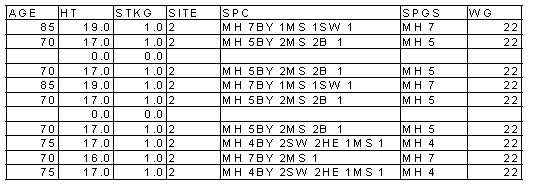
Attribute Table: The direct link between the spatial entities (i.e. polygons) and the attribute table allows a GIS to classify the forest stand on the basis of the various attributes such as dominant species type, or age etc. GIS also provides a rapid query capability of the forest stand map and the database (i.e. query for forest stands greater than 80 years old).
A geographic information system provides four sets of capabilities to handle geographically referenced data: 1) Input 2) Data Management 3) Manipulation and Analysis 4) Output.
Converts the data from an existing form into one that can be used by a GIS in a digital format. The data may be captured in either a vector format or in a raster format. This may be accomplished through manual digitizing, scanning, or from existing digital data.
Interchange Data Formats: In
order to exchange spatial and attribute data between the various types of Geographic
Information Systems, GIS software developers have established standardized spatial data
exchange formats.
GIS/CAD System |
Interchange Format |
| ArcInfo | E00 (filename.E00) |
| ArcView | SHP (filename.SHP) |
| MapInfo | MIF/MID (filename.MIF) |
| Intergraph | DGN (filename.DGN) |
| AutoCAD | DXF (filename.DXF) |
These are the functions performed by a Geographic Information System to store and retrieve data from the database. This capability is similar to that provided by database management software. The data are entered into a pre-defined structure which may or may not be inter-related.
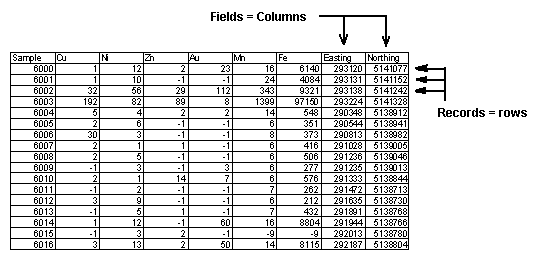
Simple Database: In its simplest form, a database can be a simple table which can be constructed using spreadsheet software such as, Excel or Quattro Pro. A simple database is also commonly referred to as a ‘flat file’. The main components to this database are the rows (or ‘records’), which in this case represents the various samples analyzed, and the columns (or ‘fields’), which represent the information pertaining to each record.
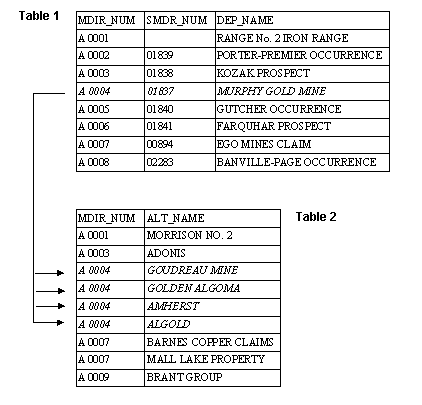
Relational Databases: Relational databases are more complex than the simple database in that the database consists of multiple tables which are inter-related. Table 1 and 2 are inter-related tables. The top row identifies the fields for each record in the table. Note that there is one common field for each table (MDIR_NUM). This field is referred to as the KEY or Primary field.
Data Manipulation and Analysis
GIS analytical functions can be broadly sub-divided into spatial vs. non-spatial analysis. Spatial analysis requires knowledge of the geographic relationships between the data (points, lines, and polygons) contained in the GIS; non-spatial analysis represents a query of the database similar to those functions in database management software. GIS manipulation and analysis functions can be sub-divided into four categories:
GIS Manipulation & Analysis |
Functions |
Maintenance and Analysis of |
Format Transformations ie. DXF to ArcView Geometric Transformations ie. map registration Transformations between map projections Spatial Editing Functions |
Maintenance and Analysis of |
Attribute Editing Functions Attribute Query Functions |
Integrated Analysis of |
Overlay Operations Neighbourhood Operations Connectivity Functions Retrieval, Classification, Measurement |
Output Formatting |
Map Annotation Text Labels Texture Patterns and Line Styles Graphic Symbols |
Geographic Information Systems have to output the data in the form of maps, tables, and text either as softcopy (on-screen or electronic file) or as hardcopy (paper or film). In considering a GIS it is important to assess the quality, accuracy, and ease of use in producing the desired output. Generally, vector-based systems can produce higher quality map output than raster-based systems.
When undertaking a GIS-based project, there are a number of issues that an organization has to consider. A definition of the goals and objectives for a Geographic Information System is required at the start, which is based on clear and realistic business objectives. When the purpose of the GIS has been established, a structured approach towards the design and implementation of a GIS can be considered.
GIS Project Structure: A GIS project can be subdivided into several stages which are similar to any engineering or development project: Concept, Design, Implementation, Operation & Maintenance.
| Conception: the process that leads to the initiation of a GIS project. The political, administrative and monetary commitments are obtained and the general system philosophy and scope are determined. |
| Design: the general philosophy during the first phase is translated into a definition of the system, within the scope and monetary constraints identified in the conception phase. This will involve: · analyzing the functions of the organization · the inter-relationship of the various functions · identifying the information requirements for each function · deciding on priorities · development of a general technical design. |
| Implementation: the process of constructing the design created in the second phase. This would involve developing a technology transfer strategy, including organizational change, training plans, roles and responsibilities of organizational units. |
| Operation and Maintenance: making the system available to users and satisfying the objectives identified during conception. It includes day-to-day technical management, enhancements, and performance evaluation. |
GIS Design Example: In converting paper maps and corresponding legend into a GIS based map with attribute table, decisions have to be made as to how various types of information (i.e. Point, Line, Area) are to be represented; this includes the symbology required, accuracy levels to be achieved, the kinds of information that will populate the attribute tables, and so on.
GIS Classification |
Resource Classification |
| Point | Building, Osprey Nest, Fishing Lodge, Mineral Occurrences |
| Line | Roads, Streams, Topographic Contours, Fractures, Faults |
| Polygon (area) | Forest Stands, Lakes, Mining Claims, Geological Units |
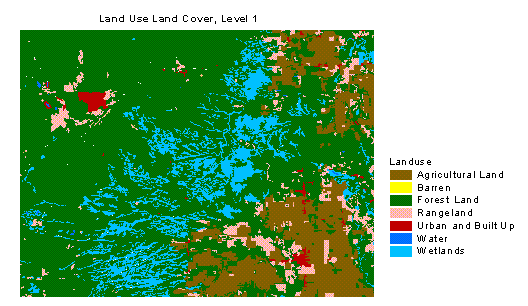
Land Use Land Cover Example: In this example, a land use land cover (LULC) map of an area is to be converted into a GIS-based digital product. The various LULC units are represented by a classification system which subdivides the units into various classes based on general and specific characteristics. In developing a structure for the attribute table, the classification system serves as the best 'model' on which to base the information which will be used to represent each polygon or LULC unit in the GIS.
Classification System (Level I,II, III)
| 4 Forest Land (Level I) 41 Broadleaved Forest (Generally Deciduous) (Level II) 411 Northern Hardwood (Level III) 42 Coniferous Forest (Level II) 421 Pine (Level III) etc... |
Attribute Table (Database): As each polygon is digitized, a new record (row) is created which is then populated with the necessary information pertaining to that LULC area.
ID |
L1 |
LABEL1 |
L2 |
LABEL2 |
L3 |
LABEL3 |
3 |
4 |
Forest Land |
42 |
Coniferous Forest |
421 |
Pine |
4 |
4 |
Forest Land |
41 |
Broadleaved Forest (Generally Deciduous) |
411 |
Northern Hardwood |
5 |
4 |
Forest Land |
42 |
Coniferous Forest |
421 |
Pine |
6 |
4 |
Forest Land |
41 |
Broadleaved Forest (Generally Deciduous) |
411 |
Northern Hardwood |
7 |
6 |
Wetlands |
62 |
Non-Forested (non-wooded) Wetlands |
622 |
Emergent Wetland |
8 |
6 |
Wetlands |
62 |
Non-Forested (non-wooded) Wetlands |
622 |
Emergent Wetland |
9 |
4 |
Forest Land |
41 |
Broadleaved Forest (Generally Deciduous) |
411 |
Northern Hardwood |
Spatial Data: Once the attribute table is populated and all the polygons are digitized, it is then possible to classify and query the spatial information based on any of the fields in the attribute table. The strength of a Geographic Information System is dependent on the design and structure of the attribute table.
